Login Client Analytics
The client analytics page allows you to view a range of data about the users of your login app.
To access the analytics page for any of the login clients you own, find the client you want to view in the Clients list on your dashboard homepage, click the ... to expand the menu, and select Analytics.

Client Details
The client details section shows you how many distinct users have logged in with this client, the last date this client's configuration was updated, the date this client was created, and a list of all login scopes that have been requested using this client ID.

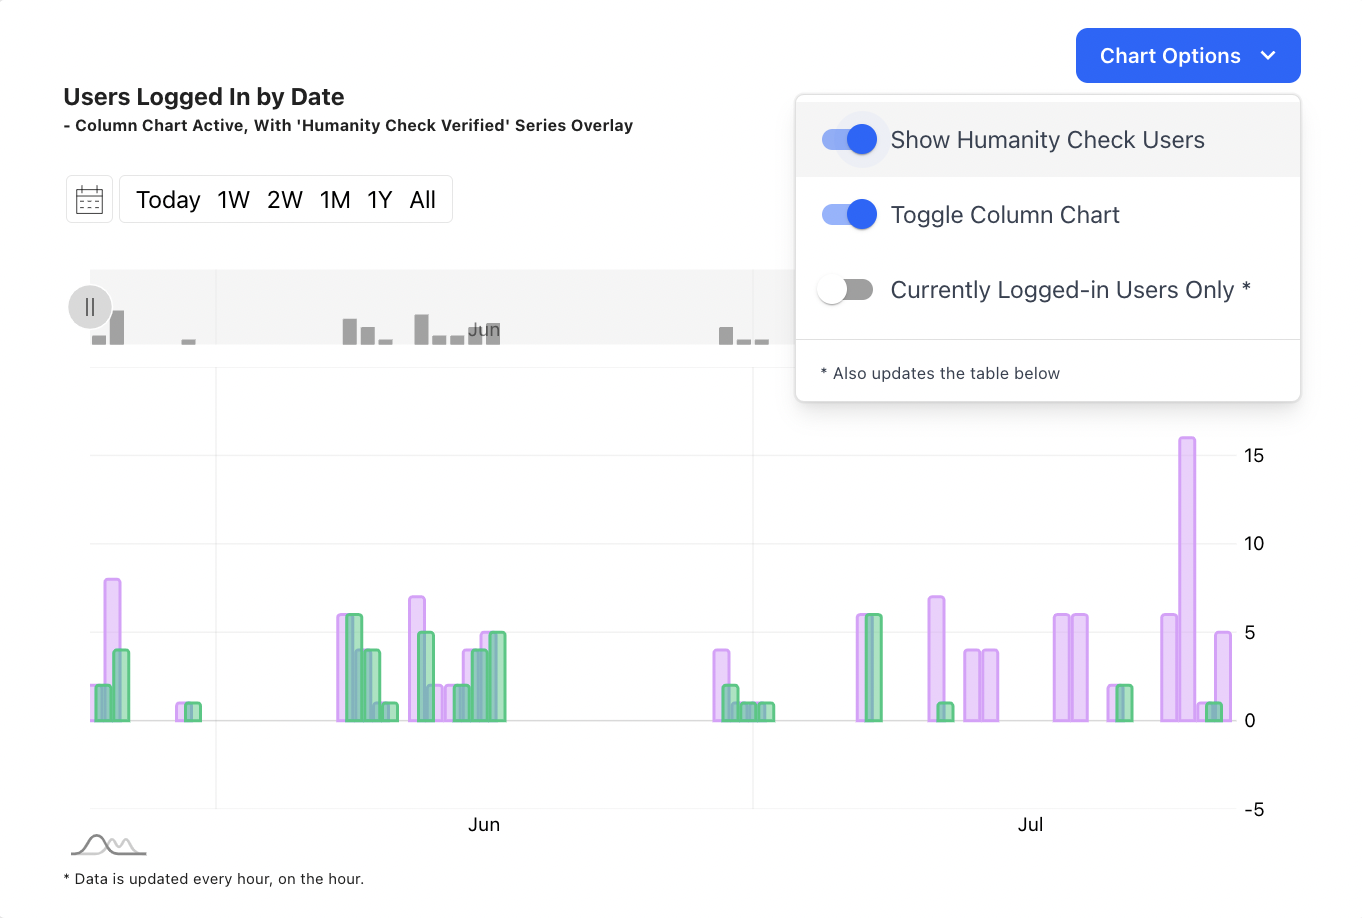
Logged-in User Chart
The logged-in user chart visualizes the daily login sessions, sorted by preset or custom date ranges.
In the Chart options menu, you can:
- Enable Show Humanity Check Users to add users with Humanity Check completed to the chart in green.
- Toggle Column Chart to change from the default area chart to a column chart.
- Enable Currently Logged-in Users Only to display only current login sessions.
Logged-in User Table
In the last section of the analytics page, you can view a table of distinct users for this login client. Click the arrows to the right of each column name to sort by column values.
For more advanced control of the table contents, see the controls to the upper right.
- Open the Columns menu to toggle the visibility of each of the columns.
- Open the Filters menu to add custom filters based on the contents of each column.
- Open the Export menu to Download as CSV or Print the user list.
